Demand for Healthcare and Health Insurance
Overview
- One of the central health economics questions: what does health insurance do?
- Early literature focused on effects of health insurance on healthcare utilization (ex post moral hazard)
- Another way to phrase the question: How much should people have to pay for healthcare?
- To answer this, we need to know the effects of different forms of insurance on healthcare utilization
The RAND Health Insurance Experiment
(see Aron-Dine, Einav, and Finkelstein (2013) for a review)
Setup
- Partnership with RAND corporation and team of health economists in 1970s
- Key question: If people pay more for healthcare, will they use less?
- Randomized 2,000 households into groups:
- free-care plan
- high-deductible (up to $5,500 in 2023 dollars) with full-insurance afterward (really an out-of-pocket maximum)
- different co-insurance rates in between (95, 50, 25, mixed)
Setup
- Experiment ran from 1974-1981, cost of $410 million (in 2023 dollars)
- RAND was insurer, collected all data on healthcare used
- Physical exam at the end of the experiment
- All data available now for researchers
Analysis
\[y_{it} = \lambda_{p} + \tau_{t} + \alpha_{lm} + \varepsilon_{it}\]
- \(i\) denotes individual and \(t\) denotes year
- \(\lambda_{p}\): plan fixed effects (main coefficients of interest)
- \(\tau_{t}\): year fixed effects
- \(\alpha_{lm}\): location, start-month fixed effects (randomization was by start month)
Results: How Much Healthcare?
- Free care plan families used $2,000 (in 2021 dollars) in care
- High-deductible plan families used $1,600 in care
- 20% increase in healthcare utilization for free care plan
- Commonly cited -0.2 price elasticity of demand for healthcare
Results: What Type of Healthcare?
- Provided medical documentation to panel of physicians
- Assiged care as highly effective versus rarely effective
- High-deductible plan families:
- 30% less highly effective care
- 30% less rarely effective care
- Conclusion: higher prices lead to less care across the board
Results: Health Outcomes
- No significant differences in health outcomes on average
- Patients with chronic conditions were worse off in high-deductible plan
Threats to validity
- Valid randomization (not really an issue)
- Adverse selection in participation (could be a problem)
- Reporting of claims (some minor concern)
Results with adjustments
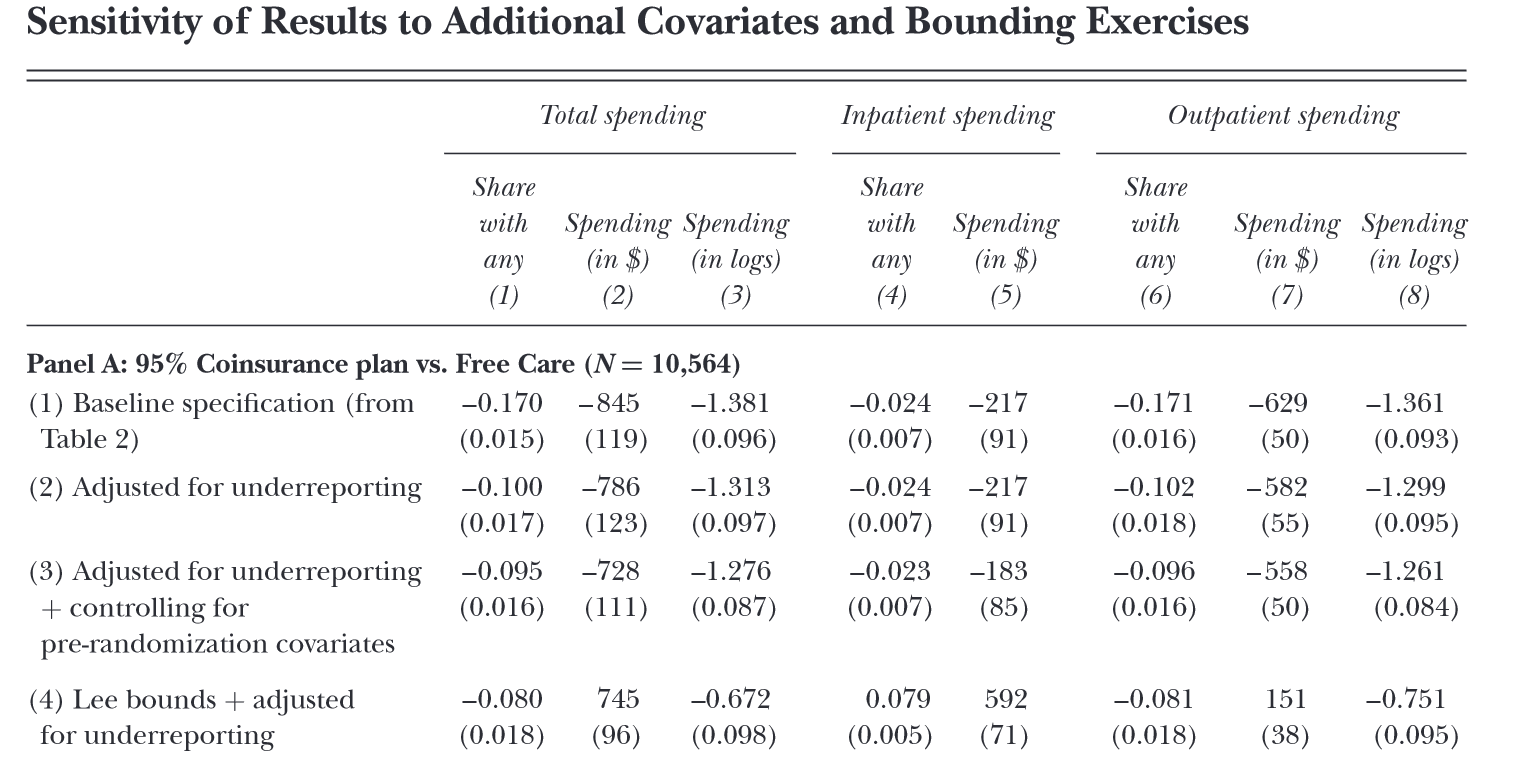
Elasticity estimates
Commonly cited -0.2 price elasticity of demand for healthcare comes from:
- Step 1: intensive vs extensive
- Group care into defined “episodes”
- Find no relationship between price and utilization within episode
- Focus on extensive margin (presence of an episode)
Elasticity estimates
Commonly cited -0.2 price elasticity of demand for healthcare comes from:
- Step 2: spot vs future price
- Compare episode rates among those close to hitting OOP max versus those already over
- No difference in episode rates
- Conclude that spot price matters
Elasticity estimates
Commonly cited -0.2 price elasticity of demand for healthcare comes from:
- Step 3: calculating elasticity
- Limit sample to part of year where people are far from OOP max (around $500)
- Calculate arc elasticities for each care setting and for different plan types
- Many estimates ‘around’ -0.2
Problems with elasticity applications
How should we predict the response to price changes in a nonlinear pricing environment when we only have a single price elasticity estimate?
Problems with elasticity applications
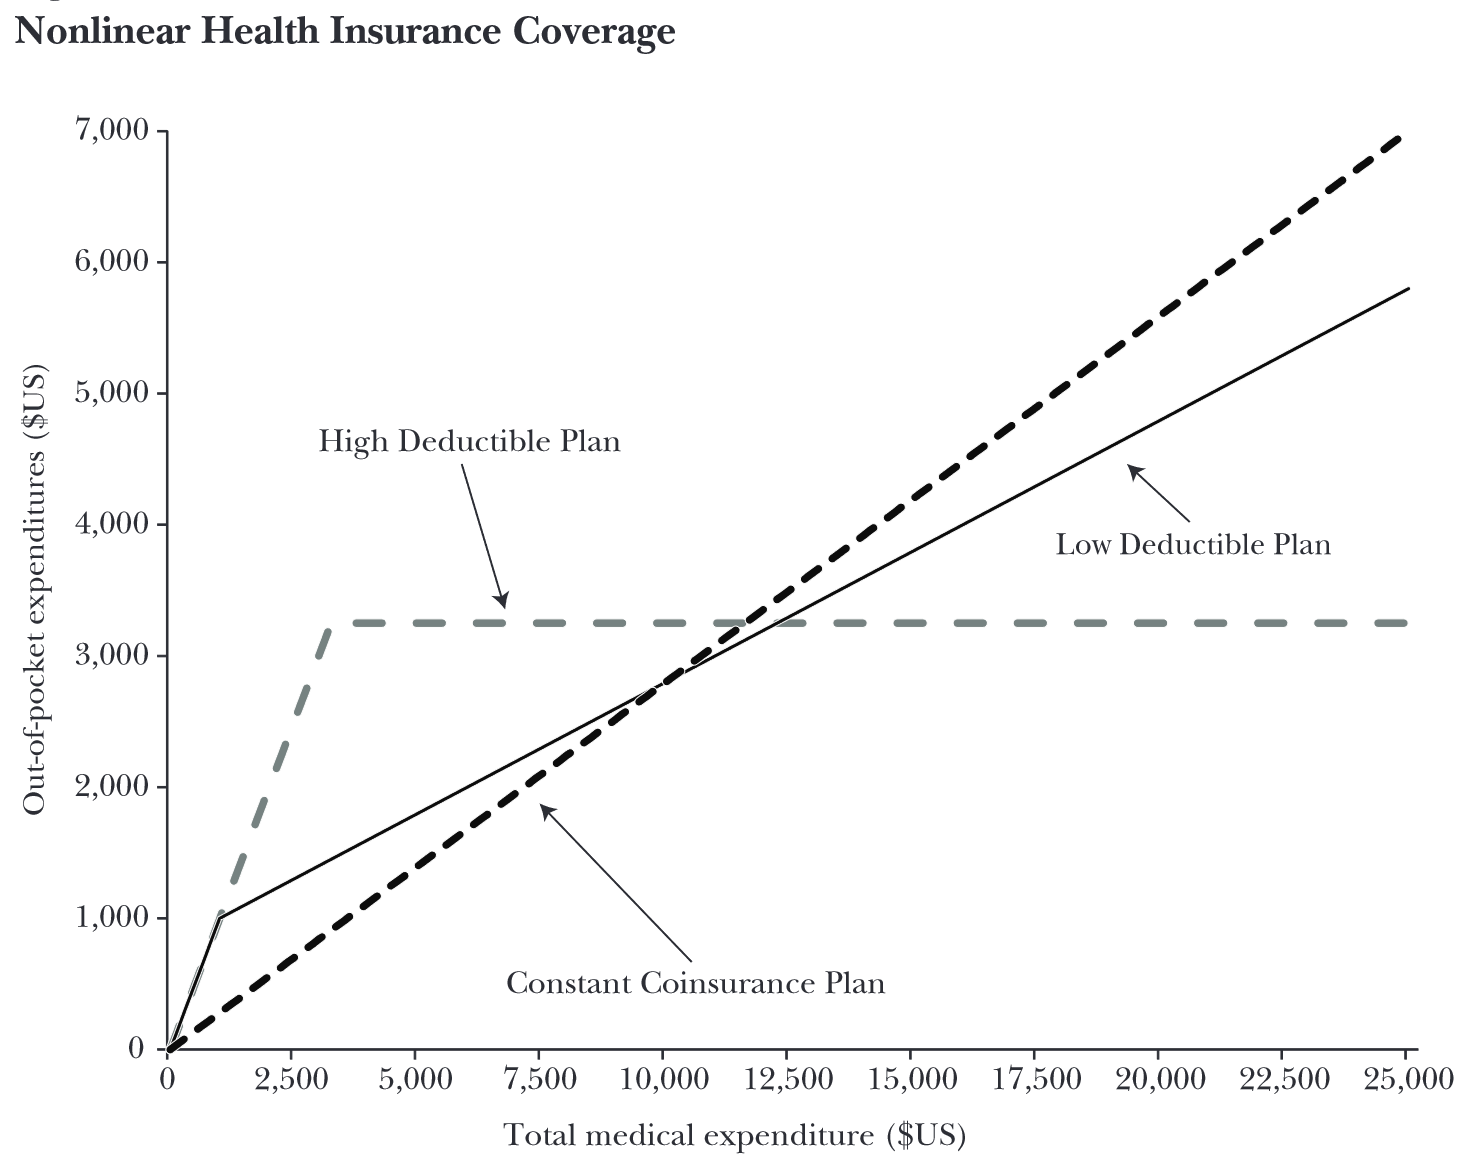
- Budget neutral in that each contract has same costs to insurer for same distribution of healthcare utilization
- Different assumptions on how to reduce plans to a single average price yield very different predictions (factor of 2)
Key takeaways
- Confident that price matters in healthcare (i.e., people respond to higher prices by reducing healthcare)
- Less confident in the magnitude of the response
- Difficult to apply single elasticity estimates to nonlinear pricing contracts
The Oregon Health Insurance Experiment
(see Finkelstein et al. (2012) for a review)
Setup
- Oregon expanded Medicaid in 2008
- 90,000 people applied for 10,000 slots
- Randomized lottery for slots
- Nearly 36,000 selected for lottery, 30% enrolled
Analysis
- Compare outcomes of those with insurance to those without
- Use lottery selection as an instrument for insurance coverage
Analysis
\[\begin{align} y_{ihj} &= \pi_{0} + \pi_{1}Ins_{ih} + \pi_{2}x_{ih} + \pi_{c}V_{ih} + \nu_{ihj} \\ Ins_{ih} &= \delta_{0} + \delta_{1}Lottery_{h} + \delta_{2}x_{ih} + \delta_{3}V_{ih} + \mu_{ihj} \end{align}\]
- individual \(i\) in household \(h\) for outcome \(j\)
- \(x_{ih}\) are covariates that are correlated with lottery sign up
- \(V_{ih}\) are other covariates thought to be correlated with outcomes (for increases in precision)
Main results
- 2.1 percentage point (30%) increase in the probability hospital admission
- 8.8 percentage point (15%) increase in the probability of taking any prescription drugs
- 21 percentage point (35%) increase in the probability of having an outpatient visit
- No change (but wide confidence intervals) in ED visits
- 0.3 standard deviation increase in reported compliance with recommended preventive care (e.g., mammograms and cholesterol monitoring)
- 6.4 percentage point (25%) decline in the probability of having an unpaid medical bill sent to a collections agency
- 20 percentage point (35%) decline in having any out-of-pocket medical expenditures
- improvements in self-reported physical and mental health, overall well-being, access to, and quality of are
References
Aron-Dine, Aviva, Liran Einav, and Amy Finkelstein. 2013. “The RAND Health Insurance Experiment, Three Decades Later.” Journal of Economic Perspectives 27 (1): 197–222.
Finkelstein, Amy, Sarah Taubman, Bill Wright, Mira Bernstein, Jonathan Gruber, Joseph P Newhouse, Heidi Allen, Katherine Baicker, et al. 2012. “The Oregon Health Insurance Experiment: Evidence from the First Year.” Quarterly Journal of Economics 127 (3): 1057–1106.